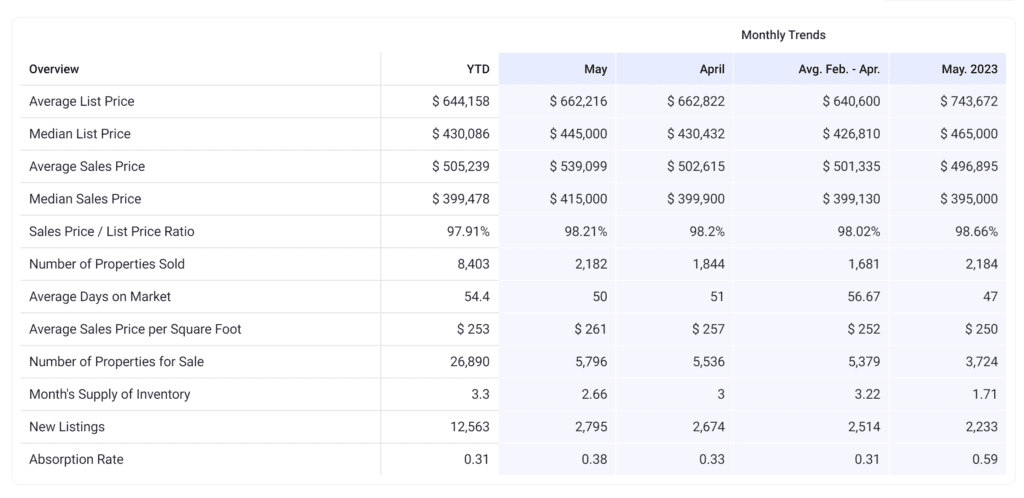
…Is a question I get all the time. Below is a snapshot of market trends for Hillsborough County for May 2024 compared to the previous three months and May 2023. If you’d like an up-to-date market report for your county, city, or ZIP code, call or text me and I’ll run a report specifically for you. 813-205-1214.

Average & Median Sales Price
The median sales price in May 2024 was $415,000, up 3.78% from $399,900 from the previous month and 5.06% higher than $395,000 from May 2023. The May 2024 median sales price was at its highest level compared to May 2023 and 2022. The average sales price in May 2024 was $539,099, up 7.26% from $502,615 from the previous month and 8.49% higher than $496,895 from May 2023. The May 2024 average sale price was at its highest level compared to May 2023 and 2022.
Average Days on Market
The average days on market (DOM) is the number of days a property is on the market before it sells. An upward trend in DOM tends to indicate a move toward a buyer’s market, a downward trend tends to indicate a move toward seller’s market. The DOM for May 2024 was 50 days, down -1.96% from 51 days from the previous month and 6.38% higher than 47 days from May 2023. The May 2024 DOM was at its highest level compared with May 2023 and 2022.
Inventory & Months’ Supply of Inventory (MSI)
The number of properties for sale in May 2024 was 5,796, up 4.70% from 5,536 from the previous month and 55.64% higher than 3,724 from May 2023. The May 2024 inventory was at its highest level compared with May 2023 and 2022. A comparatively lower MSI is more beneficial for sellers while a higher MSI is better for buyers. The May 2024 MSI of 2.66 months was at its highest level compared with May 2023 and 2022.


